Monthly Market Snapshot – June
May was another volatile month for equity markets as concerns over persistent inflation and monetary tightening weighed on investor sentiment. With mounting fears of aggressive rate hikes from the Fed potentially tipping the economy into a recession, the S&P 500 posted its longest weekly losing streak since the dot-com bubble. Adding to headwinds was a series of lackluster quarterly earnings from major U.S. retailers. The weaker-than-expected earnings from Target and Walmart indicated profit is getting pressured from rising wages and transportation costs. U.S. stocks managed to snap the seven-week losing streak after China loosened lockdown measures and U.S. President Joe Biden said he would consider easing tariffs on Chinese goods.
Canada’s benchmark S&P/TSX Composite Index was 0.2% lower in May, as eight of the benchmark’s underlying sectors were negative during the month. The decline was led by the health care sector with a loss of 25.5%. Only energy and financials managed to be in the green with returns of 7.9% and 1.4%, respectively. The Canadian market has been resilient during the broad downturn this year, thanks to the strength of the energy and materials sectors. Small-cap stocks, as measured by the S&P/TSX Small Cap Index, slid again by 2.4% in May.
The U.S. dollar depreciated by 1.2% versus the loonie during the month, dampening the returns of foreign markets from a Canadian investor’s standpoint. Note that all returns in this paragraph are in CAD terms. U.S.-based stocks, as measured by the S&P 500 Index, declined 1.4% in May. Real estate and consumer discretionary had the steepest declines during the month, falling 6.5% and 6.3%, respectively. Energy, utilities and financials managed to see gains in May, rising 13.3%, 2.3% and 1.1%, respectively. International stocks, as measured by the MSCI EAFE Index, lost 1.2% during the period, while emerging market stocks fell 1.3%.
The investment grade fixed income indices we follow were mixed in May. Canadian investment grade bonds, as measured by the FTSE Canada Universe Bond Index, lost 0.1% for the month while the key global investment grade bond benchmark increased by 0.3%. Global high-yield issues advanced 0.5%.
Turning to commodities, natural gas continued its rally with a return of 12.4% during the month, while the price of a barrel of crude oil gained 9.5%. Copper, silver and gold were in the red again, with respective losses of 2.3%, 5.9%, and 3.6%.
Inflation in Canada stayed elevated with a 6.8% year-over-year rise in April, the highest print since 1991. The increase was largely driven by food and shelter prices. The Canadian economy added 15,300 jobs in April, as the nation’s unemployment rate edged down to 5.2%. The Bank of Canada is expected to hike the policy rate by another 50 basis points to 1.5% in June as inflation stays persistent.
U.S. nonfarm payrolls grew by 428,000 in April, and the unemployment rate was unchanged at 3.6%. The consumer price index rose again in April, accelerating to 8.3% year-over-year. Shelter, food, airline fares and new vehicles were the largest contributors to rising inflation. U.S. retail sales rose again in April, increasing by 0.9%. The Federal Reserve raised its interest rate by 50 basis points in May – the largest increase in 22 years. The Fed minutes also indicated additional 50 basis point increases are likely to happen at upcoming meetings.
Extreme market volatility can put investors on an emotional roller coaster, and this may trigger impulses to get out of the market altogether. The challenge with attempting to time the market is that bottoms and peaks are only evident with plenty of hindsight, and there is not much evidence to suggest that market timing is an effective strategy.
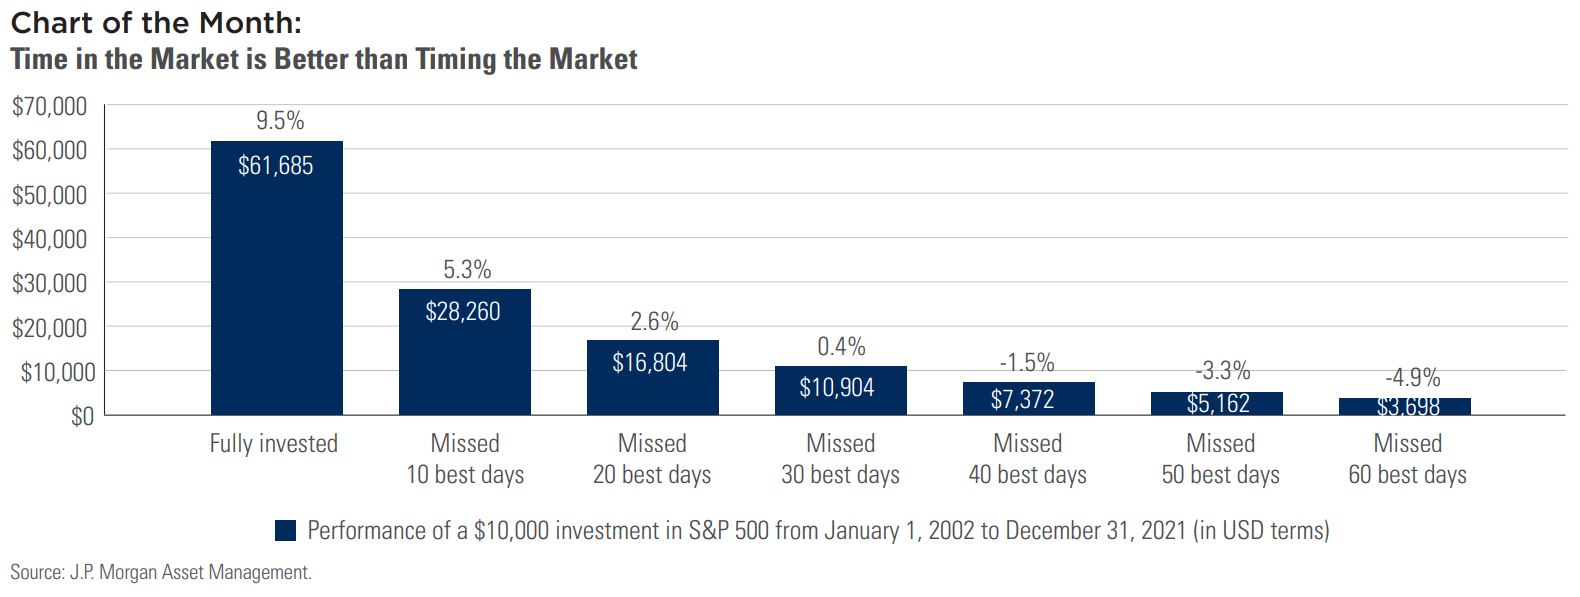
The bar on the left in the chart above shows the annualized return for the S&P 500 over the last 20 years. The bars to the right of it show the compounded return for the index if the 10 best trading days were missed, if the 20 best trading days were missed, and so on. The damage to return as a result of missing key days for the market has been catastrophic. In fact, if you remove the best 40 days from the performance of the index, it’s return would be negative. In the past 20 years, there have been about 5,000 trading days. 40 of those represent 0.8% of the total, so damaging long-term returns does not require one to be out of the market for very long.
With rising rates, nagging inflation and geopolitical tensions, there’s a good chance the elevated volatility could continue. When challenges flare up, it is key to remember your longer-term plan, and knowing the harm that can come with missing big days for the market can work to underscore that approach.
If you have any questions or concerns about your portfolio, our team is here to help. Contact us today.
Posted In: Market Updates