Monthly Market Snapshot – October
The final week of October saw many global equity markets experience downturns not seen since the height of the COVID-19 pandemic in March. The sell-off was driven by several economies reporting record-high daily coronavirus cases, with many countries reimplementing lockdown measures to mitigate the virus spread. Lack of another round of U.S. fiscal stimulus also dampened investor enthusiasm. The S&P/TSX Composite Index and the S&P 500 Index fell 4.4% and 4.3%, respectively, in Canadian dollar terms, during October’s closing week.
Canada’s benchmark index ended October down 3.4% and losses were widespread. Stocks within the information technology sector tumbled 8.7%, while consumer staples stocks fell 7.5%. The all-important financials and energy sectors finished the month down 2.4% and 4.7%, respectively. Health care, which accounts for only a small fraction of the overall value of the index, was the only sector to produce a positive return in October, gaining 7.3%. The Canadian small-cap index experienced a loss of 0.9% for the month. The Canadian dollar was little changed versus the greenback for October.
U.S.-based stocks, as measured by the S&P 500 Index, were 2.6% lower in October. The information technology and energy sectors witnessed the sharpest declines, falling 5% and 4.5%, respectively, during the month. International stocks, as measured by the MSCI EAFE Index, fell 3.9%, with European stocks retreating 5.5% during the month. Emerging markets stocks gained 2.2%, with Asian stocks improving by 1.2% in October. Note that all returns noted in this and the following paragraph are in Canadian dollar terms.
The investment grade fixed income indices we follow were marginally higher in October. Canadian investment grade bonds, as measured by the FTSE Canada Universe Bond Index, finished with a 0.3% gain for the month, while the key global investment grade bond benchmark was 0.1% higher. Global high-yield issues advanced 0.3% during the period.
Turning to commodities, the price of crude oil slid as renewed coronavirus lockdowns threatened to curtail demand. WTI oil fell 11% in October, its worst month since March. Natural gas, meanwhile, gained 32.7% during the month. The price of gold slipped 0.4%, while silver rose 0.6% during the period.
Canadian gross domestic product rose 1.2% month-over-month in August as economic activity continued to rebound. Canada added 378,200 jobs in September, as the nation’s unemployment rate fell to 9%. Canadian inflation rose 0.5% year-over-year in September, above the 0.1% increase in August. The Bank of Canada kept its policy rate at 0.25%.
U.S. gross domestic product expanded at a record annualized rate of 33.1% in the third quarter, following the worst quarter in history when the economy contracted 31.4%. U.S. nonfarm payrolls rose by 661,000 in September, as the unemployment rate fell to 7.9%. U.S. consumer prices increased 0.2% in September, while core CPI, which removes food and energy, was also up 0.2%.
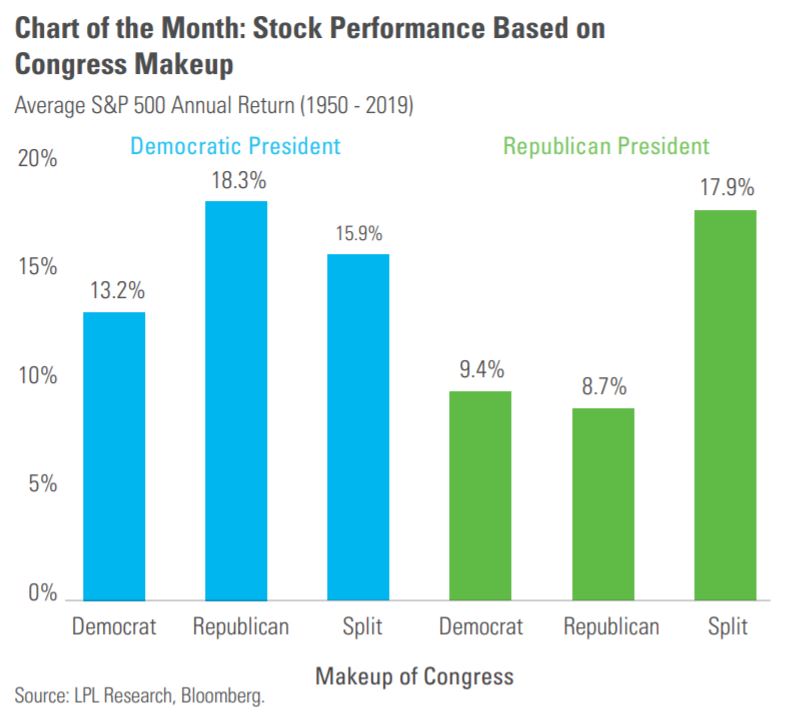
With U.S. election day behind us, we thought it would be interesting to see how the stock market performed under various president and congressional makeups. According to LPL Research, the best scenario over the past 70 years has been a combination of a Democratic president and a Republican-controlled Congress, with the S&P 500 Index producing an average annual return of 18.3%. In fact, when a Democratic president is in office, the S&P 500 has had an average return of over 13%, no matter the congressional makeup. Meanwhile, the combination of a Republican president and a Democratic-controlled Congress has resulted in the weakest returns of the scenarios considered. Finally, note that a split Congress, which will be the case until the next mid-term elections, has resulted in robust returns for investors regardless of who is sitting in the Oval Office.
Posted In: Market Updates