Monthly Market Snapshot – September
Equity market volatility ramped up in September, as the effects of COVID-19 continued to pose challenges for various regions around the world, with many countries implementing tighter restrictions to combat the second wave of the coronavirus. Uncertainty around a new stimulus deal in the U.S. also caused large swings in stock prices in September. Nevertheless, investor sentiment remained positive throughout most of the quarter, as the equity benchmarks we follow were all higher in Q3.
Canada’s benchmark S&P/TSX Composite Index was 2.4% lower in September but pulled out a 3.9% gain for the quarter. Nine of the 11 underlying sectors were in the black during Q3, led by industrials and utilities, with gains of 13.2% and 9.9%, respectively. The all-important financials and energy sectors, which account for nearly half the value of the Canadian index, produced mixed results in the third quarter. Financial services stocks finished the quarter 2.8% higher, while energy stocks declined 9.4%. Health care stocks slumped 14.4% for the quarter. Small-cap stocks, as measured by the S&P/TSX Small Cap Index, advanced 6% in Q3.
The Canadian dollar was 1.9% higher versus the greenback during the quarter, which dampened returns from foreign equity markets from a Canadian investor’s standpoint. Note that all returns noted in this paragraph are in Canadian dollar terms. U.S.-based stocks, as measured by the S&P 500 Index, gained 6% in the third quarter, led by the consumer discretionary and materials sectors, with respective gains of 12.3% and 10.2%. Technology companies produced solid gains, as the sector jumped 9.2% in Q3. International stocks, as measured by the MSCI EAFE Index, added 1.9%, while emerging markets climbed 6.3% during the period.
The investment grade fixed income indices we follow were higher in Q3. Canadian investment grade bonds, as measured by the FTSE Canada Universe Bond Index, finished with a 0.4% gain for the quarter, while the key global investment grade bond benchmark rose 2.7%. Global high-yield issues advanced 4.5% during the period.
Turning to commodities, the price of a barrel of oil continued to rebound, rising 2.4% in Q3. Gold produced a 4.8% gain during the quarter, while silver jumped 26.7%.
Canadian gross domestic product rose 3% month-over-month in July as economic activity continued to rebound. Canada added 245,800 jobs in August, as the nation’s unemployment rate remained at 10.2%. Canadian inflation rose 0.1% year-over-year in August, matching the 0.1% increase in July.
U.S. gross domestic product contracted at an annualized rate of 31.4% in the second quarter, the deepest dive in GDP on record for the world’s largest economy. U.S. nonfarm payrolls rose by 661,000 in September, as the unemployment rate fell to 7.9%. U.S. consumer prices increased 0.4% in August, while core CPI, which removes food and energy, was also up 0.4%. The Federal Reserve kept its benchmark interest rate near zero and promised to keep rates there until inflation rises consistently.
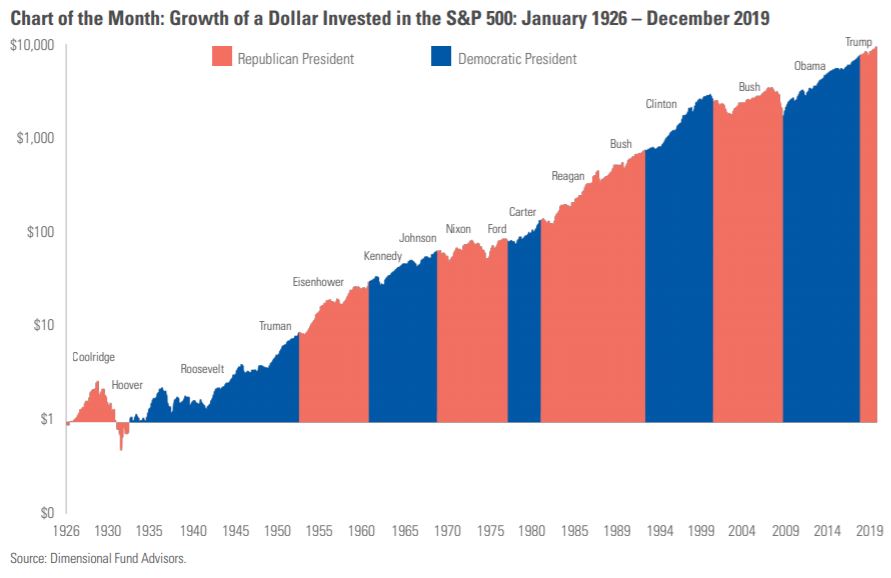
We are only weeks away from the U.S. presidential election and a common question is how the outcome will impact the stock market. Have returns been better under Democratic or Republican administrations? Looking at data going back to 1926, the U.S. stock market, as measured by the S&P 500 Index (in local currency terms), does not show an obvious pattern based on which party controls the White House. In fact, U.S. stocks have provided substantial returns regardless of who is leading the executive branch. The key takeaway is that over the long term, the stock market has trended upward regardless of whether a Republican or Democrat is in office. And trying to make investment decisions based on the outcome of the election is unlikely to yield any excess returns.
Posted In: Market Updates