Monthly Market Snapshot – August

Stocks around the globe continued to rally in August, as the strong momentum from the lows of March proceeded unabated. It was the fifth straight month of gains for major equity indices, with some key U.S. benchmarks hitting record highs toward the end of the month. There has been a resurgence in COVID-19 cases around the world after lockdown measures were eased, with some regions confirming the arrival of a “second wave”. Nevertheless, investor sentiment remained positive as stocks continued to march higher throughout the month of August.
The S&P/TSX Composite Index was 2.1% higher in August, and through the end of the month, was up 47% from the bear market bottom on March 23. Financials and industrials were the top-performing sectors in August, with gains of 6.7% and 4.2%, respectively. The influential energy sector posted a gain of 1.6%. The healthcare sector saw the biggest drop for the period, falling 7.5%. Small-cap stocks, as measured by the S&P/TSX Small Cap Index, advanced 3.9% for the month.
The Canadian dollar was 2.8% higher versus the greenback during the month, dampening returns in foreign equity markets from a Canadian investor’s standpoint. Note that all returns in this paragraph are in Canadian dollar terms. U.S.-based stocks, as measured by the S&P 500 Index, gained 4.0% in August and closed at an all-time high on August 30. The technology-heavy NASDAQ also hit a record high to close out the month. Tech companies drove gains in U.S. stocks, as the sector soared 8.7% in August. The consumer discretionary, telecom and industrials sectors also had solid performances, with respective gains of 6.4%, 6.0% and 5.3%, during the month. International stocks, as measured by the MSCI EAFE Index, added 2.0% in August, while emerging markets slipped 0.7%.
The investment grade fixed-income indices we follow were lower in August. Canadian investment grade bonds, as measured by the FTSE Canada Universe Bond Index, finished with a 1.1% loss for the month, while the key global investment grade bond benchmark fell by 0.2%. Global high-yield issues advanced 0.8%.
Turning to commodities, the price of oil continued to trend upward, rising 5.8% in August. Gold saw a marginal gain of 0.4%, while silver jumped 17.4%.
Canadian gross domestic product fell at an annualized rate of 38.7% in the second quarter amid the fallout from the coronavirus pandemic. It was the worst contraction for the Canadian economy of all time. Economic activity continued to rebound in June, as GDP rose 6.5% month-over-month. Canada added 418,500 jobs in July, as the nation’s unemployment rate fell to 10.9%. Canadian inflation rose 0.1% year-over-year in July.
U.S. gross domestic product contracted at an annualized rate of 31.7% in the second quarter, the deepest dive in GDP on record for the world’s largest economy. U.S. nonfarm payrolls rose by 1.8 million in July, as the unemployment rate fell to 10.2%. U.S. consumer prices increased 0.6% in July, while core CPI, which removes food and energy, was also up 0.6%. Federal Reserve Chairman Jerome Powell signalled the central bank would stay accommodative for longer as it would allow inflation to run moderately above its 2% target following a period of below-average inflation.
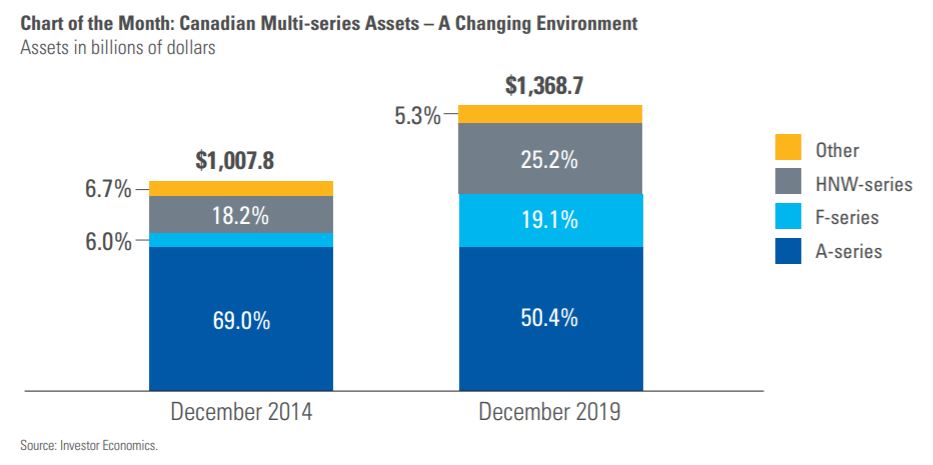
The original foundation of the Canadian mutual fund industry was the embedded trailer fund, and this commission type continues to have substantial representation, but its share of the market has been trending lower. F-series funds have seen their share of industry assets move to 19% by the end of 2019 from 6% just five years earlier. Similarly, high-net-worth series, the bulk of which are in fee-based accounts, now make up a quarter of total fund assets, up from 18% five years ago. This evolution has been driven by a need for greater pricing flexibility, enhanced fee transparency and regulatory inducement. It likely will be a while yet before fee-based mutual fund assets exceed the asset base of embedded commission funds, but the gap should continue to close from here as fee-based fund options have been dominating the net flows story. In 2019, F-series funds pulled in $15.7 billion in net new money, while all other retail mutual fund series saw an aggregate net redemption total of $3.5 billion.
Posted In: Market Updates

