Monthly Market Snapshot – July
A streak of volatile trading extended into June as investors focused on the highest inflation print in 40 years. Renewed recession jitters contributed to the continuing stock market sell-off, leading to the S&P 500’s first bear market since March 2020. Federal Reserve Chairman Jerome Powell stated at a Senate Committee meeting that a soft landing would be very challenging, while a recession is a possibility due to the central bank’s unconditional commitment to taming inflation. U.S. consumer confidence deteriorated to a 16-month low in June, raising concerns that consumers will curb spending in anticipation of persistently high prices. Amid the myriad of global crises facing markets, the S&P 500 ended the first half of 2022 lower by 20.6% for its worst start to a year since 1970.
Canada’s benchmark S&P/TSX Composite Index was 9.0% lower in June, resulting in a 13.8% decline for the benchmark in Q2. All 11 of the benchmark’s underlying sectors were negative during the quarter, led by health care and information technology, with losses of 49.8% and 30.8%, respectively. Small-cap stocks, as measured by the S&P/TSX Small Cap Index, slid by 21.2% for the quarter.
The U.S. dollar appreciated by 3.0% versus the loonie during the quarter, providing a boost to returns of foreign markets from a Canadian investor’s standpoint. Note that all returns in this paragraph are in CAD terms. U.S.-based stocks, as measured by the S&P 500 Index, declined 6.7% in June, and finished the quarter lower by 13.8%. The benchmark’s quarterly loss was led by the consumer discretionary, telecommunication services, and information technology sectors, with respective declines of 24.0%, 18.4%, and 18.0%. International stocks, as measured by the MSCI EAFE Index, lost 12.7% during the quarter, while emerging markets lost 9.6% in Q2.
Canadian investment grade bonds, as measured by the FTSE Canada Universe Bond Index, declined by 5.7% during the quarter. The key global investment grade bond benchmark and global high-yield issues were down 8.3% and 10.5%, respectively, during the quarter.
Turning to commodities, the price of a barrel of crude oil gained 5.5% in the second quarter, while natural gas was 3.9% lower. Copper, silver and gold had a negative quarter, with respective losses of 21.8%, 19.3% and 7.3%.
Inflation in Canada stayed elevated with a 7.7% year-over-year rise in May, the highest print since 1983. The year-over-year increase in May was largely driven by higher gasoline prices, which rose 48% from a year ago. The Canadian economy added 39,800 jobs in May, as the nation’s unemployment rate improved to 5.1%. The Bank of Canada increased the policy rate by 50 basis points for a second straight time in June and is expected to hike the rate again by 75 basis points in July.
U.S. nonfarm payrolls increased by 390,000 in May, and the unemployment rate held at 3.6%. The consumer price index rose again in May, accelerating to 8.6% year-over-year. Food, energy and shelter were the largest contributors to rising inflation. U.S. retail sales declined in May by 0.3%. The Federal Reserve raised its interest rate by 75 basis points in June, which was the biggest rate increase since 1994. Chairman Powell indicated the central bank could raise interest rates by a similar magnitude at the July policy meeting.
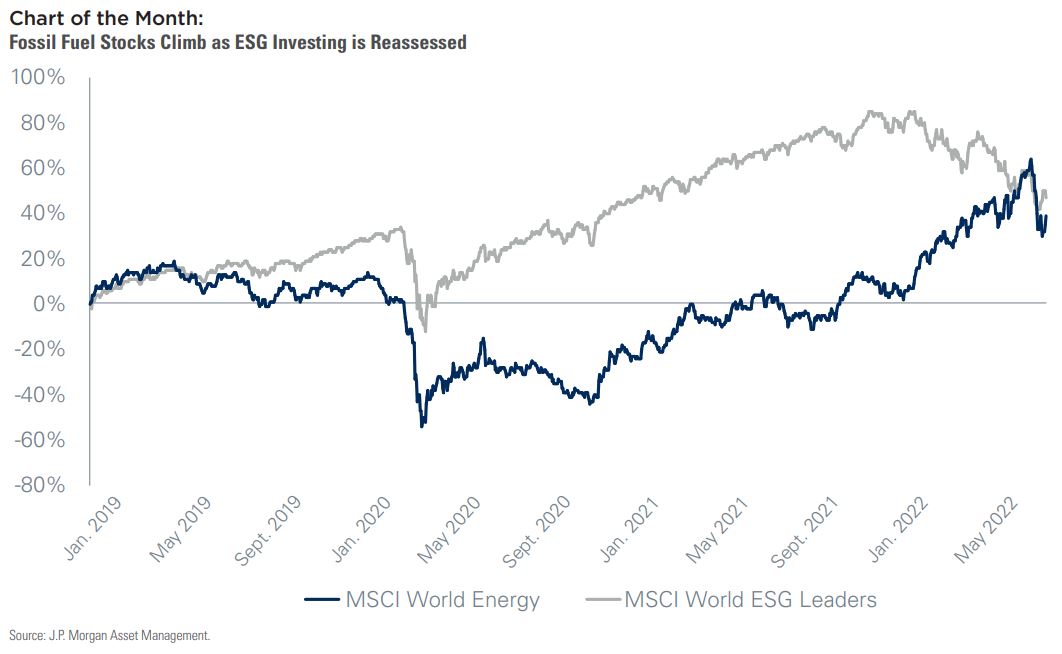
Some investors looking to incorporate ESG into their portfolios simply follow the composition of ESG benchmarks that are produced by various index providers. It is common for many of these benchmarks to screen out energy. Case in point, the MSCI World ESG Leaders index currently has an energy allocation in the low single digits. There was a period of massive underperformance for energy stocks leading into and during the Covid downturn, so any strategy that systematically avoided energy likely outperformed the broader market, and certainly outperformed any energy stock index. Since they bottomed out, energy stocks have been top performers, suggesting that any benchmark that systematically avoids this sector likely has underperformed the broader market. The Chart of the Month shows the cumulative returns of a pair of MSCI benchmarks going back to the start of 2019, illustrating that after falling behind badly, returns for energy stocks have now totally caught up with the performance of the MSCI World ESG Leaders index. This begs the question – is the outright exclusion of particular sectors from a portfolio the right approach to ESG investing, or is a more nuanced approach appropriate? This is an interesting subject to ponder.
Posted In: Market Updates